In light of the growing importance of user privacy and following the launch of Apple’s Ad Tracking Transparency framework in 2021, more app and mobile advertisers moved their budgets to focus on Android. That’s according to a report from mobile performance agency AdQuantum and intelligence platform SocialPeta.
Mobile advertisers reconsider their investments
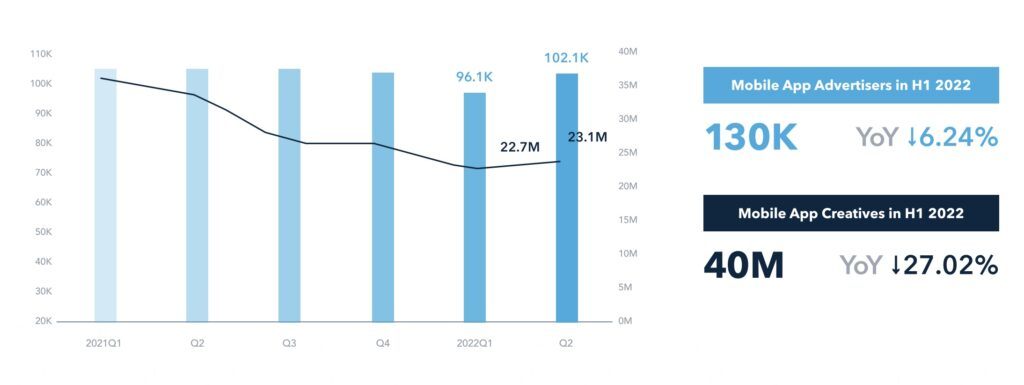
During the first half of 2022, the number of mobile and app advertisers dropped 6% year-on-year while total creatives dropped 27% month-on-month. Europe and America saw the most significant decline at 30% and 21% year-on-year, respectively.
However, advertisers increased by 10% in the Middle East, South America, South Asia and other emerging markets. APAC has some of the most engaged mobile gamers with 70% pre-registering for games and the average session length surpassing the global average of 30 minutes by 4 minutes.
Marketers move to focus on quality and UGC
The drop in creatives can be attributed to a growing number of marketers focusing on quality over quantity. The total number of mobile game creatives declined 28% during H1 2022. Casual and puzzle games attracted higher percentages of creatives while in non-gaming reading and tool apps saw creatives jump. Shopping app creatives declined 2% year-on-year.
Non-gaming app categories attracting highest percentage of app creatives
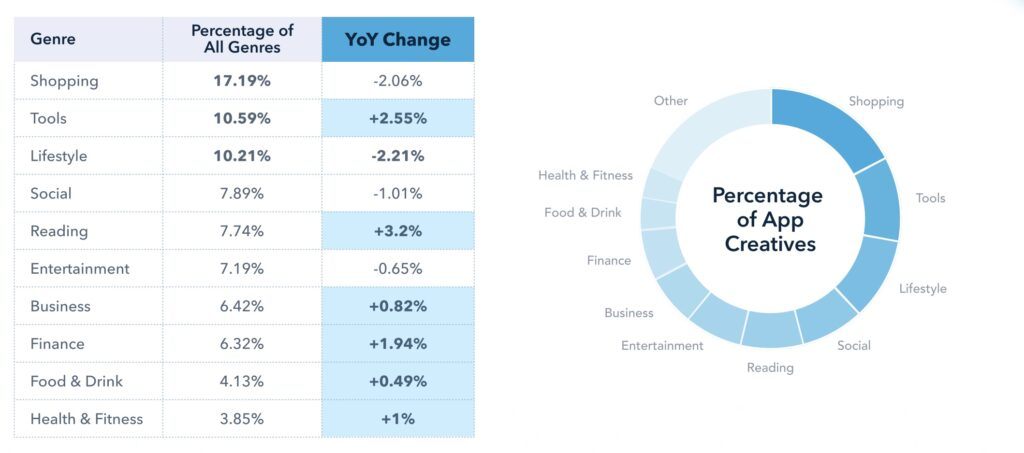
Source: AdQuantum
Meta continues to be the main mobile paid traffic source, particularly for non-gaming apps. When it comes to gaming apps, the social platform is more closely followed by Instagram and Messenger.
Android attracts more creatives than iOS
The average app creative on Android was 171 more than on iOS. Android had about 70% of mobile game advertisers and creatives and 60% of total advertisers. The average percentage of creatives per advertiser on Android was 14% more than that on iOS.
Percentages of creatives for iOS (blue) versus Android (green)
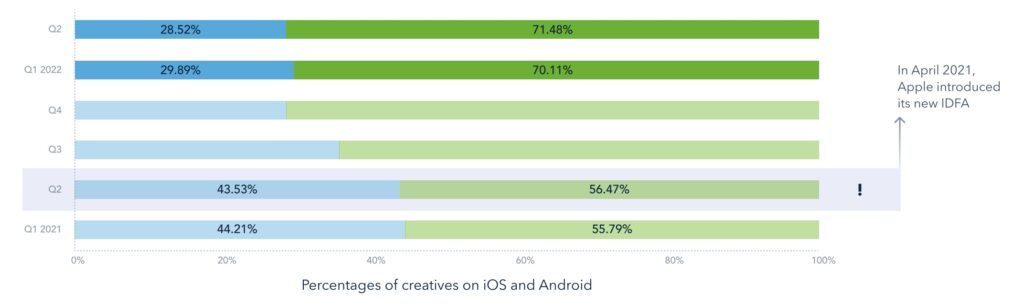
Source: AdQuantum
“Operating in a post-ATT environment, gaming apps (particularly hyper casuals) have led the way in getting users to opt-in when asked if an app can track their activity. According to Adjust data, gaming apps currently boast a 34% opt-in rate, followed by social at 22%, and e-commerce apps at 21%. Hyper casual reaches as high as 51% in some regions,” says Elena Ivanova, Senior Account Executive, Adjust.
CPM is a top user acquisition strategy
When it comes to user acquisition, US marketers still prefer CPM. The average CPM was over $20 but the US had the highest advertising cost at an average CPM of $28, CPC of $4 and CTR of 1.2%.
Advertising costs for mobile non-gaming apps continue to rise
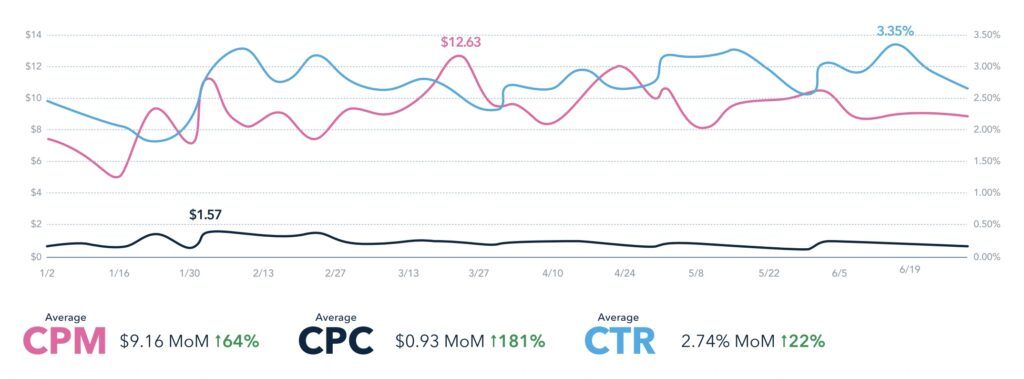
Source: AdQuantum
In the second half of the year, advertising costs for non-gaming apps rose to $9, up 64% from H1 2021, and $19 for game apps (up 18%).
Key takeaways
- Number of mobile and app advertisers dropped 6% year-on-year while total creatives dropped 27% month-on-month in H1 2022
- Advertisers increased 10% in the Middle East, South America, South Asia and other emerging markets
- Android had about 70% of mobile game advertisers and creatives and 60% of total advertisers
The post Android accounted for 70% of app ad creatives in second half of 2022 appeared first on Business of Apps.
source https://www.businessofapps.com/news/android-accounted-for-70-of-app-ad-creatives-in-second-half-of-2022/